Editor’s Note: This experimental study compares learning from a computer simulation with a traditional electronics laboratory. The simulation eliminates the time required for equipment setup, reduces computation time, and increases accuracy and reliability of results. Human variables that lead to possible errors and ambiguity are reduced. Overall, the computer simulation results in time savings, less ambiguity, greater accuracy, and an overall increase in learning.
Changing the Nature of Undergraduate
Electronics Science Practical Work
Yogendra Babarao Gandole
Introduction
Advancing technology has opened many doors in education. It is a long time since televisions and VCRs were first used in teaching. After something has been taught conventionally, teaching the topic visually adds a new level of understanding for the student.
The next step was to add interactivity. Not only was the student be able to see what is involved, but he or she would be able to learn from hands on experience. Computers are an effective way to accomplishing this.
Computers can also be used to design and access supplemental references. When used before a lab, these increase familiarity with certain lab procedures as shown in an experiment involving first-year undergraduate Electronics students. In this study, the experimental group used computers for selected electronic experiments; the control group studied by traditional methods (printed material and demonstration of experiments). A competency test determined the level of skill acquired by learners of both groups. The test was administered three times - as a pretest, posttest and retention test. The investigator analyzed test data to compare acquisition of knowledge and skills for each student against the predetermined objectives. Specific goals for the computer software support were to:
Communicate basic knowledge (theory) related to practical work in electronics.
Assist students in selecting the measuring instruments and electronics components required to perform an experiment in laboratory.
Develop competency in circuit assembly.
Demonstrate correct experimental procedures.
Simplify calculation and obtain accuracy in design and results.
Background
Many researchers have studied the effects of using computers in various aspects of classroom learning. In general, the research has focused on four areas: achievement, attitudes, group and individual behavior, and gender interactions. Results for each of these areas is summarized below.
Achievement
Several studies have focused on how use of computers affects students’ achievement (Brasell, 1987; Brungardt & Zollman, 1995). Typically, these studies define achievement very narrowly, for example, graphing skills or a single kinematics concept. Often achievement is defined as the ability to perform a specific task or skill, or a set of tasks and skills. Very few studies look at achievement in any broader sense, such as overall lab performance or course grades (Tsai, Bethel, & Huntsberger, 1999; Leonard, 1992). A few meta-analyses have examined the literature on how computers affect achievement (usually defined narrowly), and found no clear answer on whether or not computers in the classroom enhance student achievement (Kulik & Kulik, 1980, 1986). In college physics, the use of microcomputer-based labs (MBLs) has had mixed results for student performance on certain skills and concepts (Beichner, 1996).
Attitudes
One of the recurring advantages attributed to using computers in the classroom is more positive student attitudes (Brasell, 1987; Brungardt & Zollman, 1995). Using computers in a classroom is believed to lead to more positive attitudes in students because computers can do many things quickly and precisely, and because many students prefer using computers. However, there is little research to support such claims. This feeling that computers engender more positive attitudes seems to stem more from teachers’ personal experiences rather than from actual research (for example, Brasell, 1987 and Cordes, 1990). The limited research available suggests that computers can lead to more positive attitudes for specific student groups (males, younger students).
Although the importance of hands-on labs to the science curriculum cannot be denied, Garcia (1995) cites several advantages of computer simulations compared to laboratory activities. First, there appear to be important pedagogical advantages of using computer simulations in the classroom. Second, the purchase, maintenance, and update of lab equipment is often more expensive than computer hardware and software. Furthermore, there is no concern for students' physical safety in this learning environment.
Thomas and Hooper (1989) discuss the instructional use and sequencing of computer simulation and its effect on students' cognitive processes. The sequence in which learning occurs influences the stability of cognitive structures (Ausubel, 1968). New knowledge is made meaningful by relating it to prior knowledge and optimization of prior knowledge is accomplished through sequencing. According to Gokhale (1991), simulations used prior to formal instruction build intuition and alert the student to the overall nature of the process. When used after formal instruction, the program offers the student an opportunity to apply the learned material.
There is evidence that simulations enhance students' problem solving skills by giving them an opportunity to practice and refine their higher-order thinking strategies (Quinn, 1993). Computer simulations were found to be very effective in stimulating environmental problem solving by community college students (Faryniarz & Lockwood, 1992). In particular, computer simulation exercises based on the guided discovery learning theory can be designed to provide motivation, expose misconceptions and areas where knowledge is deficient, integrate information, and enhance transfer of learning (Mayes, 1992). In three studies, students using the guided version of computer simulation surpassed unguided students on tests of scientific thinking and a test of critical thinking (Rivers & Vockell, 1987). As a result of implementing properly designed simulation activities, the role of the teacher changes from a mere transmitter of information to a facilitator of higher-order thinking skills (Woolf & Hall, 1995). According to Magnusson and Palincsar (1995), simulations are seen as a powerful tool to teach not only content, but also thinking or reasoning skills that are necessary to solve problems in the real world.
Purpose of the Study
This study examined the effectiveness of computer software in traditional lab activities to enhance overall student competency in conducting electronics experiments. The following research questions were examined:
Will there be a significant difference in theoretical knowledge of electronics among students in electronics?
Will there be a significant difference in overall competency of students regarding various electronics experiments
Will there be a significant difference in time required to perform the various experiments.
Methodology
Population And Sample
For convenience, the investigator limited this experiment to the Amravati Division of Maharashtra State, in India. There are 12 colleges in Amravati University which offer undergraduate Electronics subjects. The total population for FY B.Sc. is approximately 200. The research is limited to practical work, available class offerings, and computer labs. Four colleges were selected for samples to ensure reliability and depth of information.
Selection Of Groups:
Respondents for the investigation were first year science students in four colleges that offer electronics, namely Brijlal Biyani Mahavidyalaya Amravati, Adarsha Mahavidyalaya, Dhamangaon Rly, Shivaji Science College Akola and Amlokchand Mahavidyalaya Yavatmal.
On the basis of learner performance in a previous achievement test in electronics, FY B.Sc. classes were divided into two groups (experimental and control), each with 50students. Sampling was done by a stratified random sampling method.
A ‘t’ test was administered to find out the significance of the difference between mean scores of the control group and experimental group in the pre test. The analysis provided that there was no significant difference between the two groups. It established the fact that the two groups selected on the basis of the achievement test were nearly equivalent.
Tools Construction :
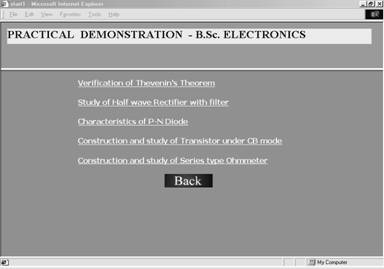
The investigator selected the five experiments of in electronics of FY.B.Sc. Syllabus, namely:
Verification of Thevenin’s Theorem,
Construction and study of characteristics of PN Junction diode,
Construction and study of half-wave rectifier,
Construction and study of transistor under CB mode and
Construction and calibration of series type ohmmeter.
First, the investigator determined learner difficulties in performing the experiment with the help of a diagnostic test.
In the first phase, the pretest was conducted on both control and experimental groups. The pretest contained 30 multiple choice questions to measure achievement and 11 check points per experiments to measure competency. A tryout of the test was administered to 30 students of FY B.Sc. The same test was administered to the same persons at a later date, and the two sets of scores correlated to determine the reliability of test items. Validity was measured by correlating the achievement test score and pre-exam physics scores for FY B.Sc. An item analysis was carried out on the results that employed information on item difficulty. Reliability was estimated to be using the test-retest repetition method. The coefficient of correlation was 0.92, 0.97 and 0.9762 showing that the test was satisfactorily reliable. Also the correlation coefficient was 0.88, 0.86 and 0.93 showing that the test was satisfactorily valid.
The pretest was administered to all participating students to assess prior knowledge of selected experiments and initial equivalence between groups.
In the second phase, computer software was developed as per requirements. Computer software support was given to the experimental group for two hours daily for 15 days. Students performed experiments and recorded their observations as instructed in the computer software. Competence in performing the experiment was examined with the help of competency test and observation of students (Checklist) while performing the experiment. The control group was taught by traditional method. In the third phase, a posttest was administered to measure treatment effects. This test was designed to assess the content that was previously learned and how students applied the learned material. The pretest, posttest and retention test were the same test. Since the study was conducted over a six month period, there was limited concern for the students becoming "test-wise". A retention test was conducted on both groups three months later.
Development Of Computer Software Support
The software was developed using mixed mode design methodology. It selectively used the objects of, top-down and bottom-up design based on the current task to solve. Overall the development structure could be called evolutionary with some rapid prototyping.
Steps In Software Development
Clear understanding of the problem: Problem Specification.
Careful solution design: Paying attention all the constraints:
Transform algorithm into a program code: Abstraction and coding.
Complete debugging: Error removal.
Thorough testing:
Maintenance dictated by environmental changes.
Drafting The Frames In Computer Software
A frame presents a small unit of information, requires active responses, and may give immediate reinforcement. For the present study, the investigator prepared the programme in Visual Basic, Visual C++, HTML and SPICE. The investigator ensured that the frames were unambiguous, brief, simple and straightforward with sequential presentation of frames for each of different mode, viz. simulation, demonstration, laboratory guide, experiment result calculation and design of circuit. The software provided a multimedia platform to attract the senses of learner for ease and happy learning.
Analysis Of Data
The main point of this study was to determine the results of adding computer software support to an electronics laboratory practical learning. Various measures were used to determine different effects on students: tests and grades to measure achievement, to measure attitudes, to measure skills, and to measure opinion regarding computer software support.
After collecting the data, analysis was made. Mean, Standard deviation and Coefficient of correlation were calculated for the pre and posttest scores for the control group and experimental group. Using “t” test, significance of the difference between the mean of the pre, post and retention test was computed for both the groups separately. Further, relationship between pre and posttest scores for control and experimental groups were studied. The significance of difference between the pretest, posttest and retention test scores for control group and experimental group was tested employing “t” test. The level of significance (alpha) was set at 0.01 for all tests of significance.
Achievement And Competency Test Analysis :
Table 1 summarizes the analysis of pretest scores both the groups of FY.B.Sc. students. The mean of the pretest scores for the experimental group was not significantly different from the control group for all classification. Hence it was concluded that treatment groups were similar.
Table 1
Comparison of Pretest Performance : FY. B.Sc.
Test Type : Achievement test
|
| Experimental Group | Control Group |
|
| ||||
S. | Category | N | Mean | S.D. | N | Mean | S.D. | ‘t’ (0.01) | P |
1 | All Students | 50 | 14.16 | 4.4237 | 50 | 14.36 | 4.3209 | NS(0.23135) | 18.25 % |
2 | All male | 25 | 13.6 | 3.87814 | 25 | 13.6 | 3.57770 | NS(0.0) | 0.00 % |
3 | All female | 25 | 14.72 | 4.6606 | 25 | 15.12 | 4.83586 | NS (0.34039) | 26.50 % |
A ‘t’ test was conducted on the pretest scores for two treatment groups. The mean of the pretest scores for the all experimental group students (14.16) was not significantly different from the control group (14.36) (‘t’ =0.23135) at 0.01 alpha level. Similarly the mean of experimental group male students (13.6) was not significantly different from the control group male students (13.6 ) (t=0 at 0.01 level), the mean of experimental group female students (14.72) was not significantly different from the control group female students (15.12 )(t=0.34039 at 0.01 level).
Table 2
Comparison of Pretest Performance : FY. B.Sc.
Test Type : Competency Test
|
| Experimental Group | Control Group |
|
| ||||
S | Category | N | Mean | S.D. | N | Mean | S.D. | ‘t’ (0.01) | P |
1 | All Students | 50 | 18.62 | 3.59382 | 50 | 18.76 | 3.83958 | NS (0.18823) | 14.89% |
2 | All male | 25 | 19.48 | 4.09018 | 25 | 19.24 | 3.95251 | NS (0.21097) | 16.62% |
3 | All female | 25 | 17.76 | 2.83943 | 25 | 18.28 | 3.66081 | NS (0.5612) | 42.27% |
Table 2 summarizes the analysis of pretest scores of FY.B.Sc. students for both groups. The mean of the pretest scores (18.62) for the experimental group was not significantly different from the control group (18.76) (‘t’= 0.18823 at 0.01 alpha level). Hence it was concluded that treatment groups were similar in competency.
Table 3
Comparison of Test performance by Instructional method :
Posttest : FY. B.Sc
Test Type: Achievement test
|
| Experimental Group | Control Group |
|
| ||||
S | Category | N | Mean | S.D. | N | Mean | S.D. | ‘t’ (0.01) | P |
1 | All Students | 50 | 43.04 | 7.0227 | 50 | 36.8 | 4.7833 | S(5.1928) | 99.99 % |
2 | All male | 25 | 43.28 | 7.9171 | 25 | 35.92 | 4.749063 | S(3.9860) | 99.99 % |
3 | All female | 25 | 42.8 | 5.9866 | 25 | 37.68 | 4.653773 | S (3.376098) | 99.99 % |
Table 3 summarizes the analysis of posttest scores of FY.B.Sc. students for both the groups. The mean of the posttest scores (43.04) for the experimental group was significantly higher than the control group (36.8). This difference was significant at the 0.01 alpha levels (‘t’= 5.1928). Hence it was concluded that the theoretical knowledge of experimental group students was raised as compared to control group students.
Table 4:
Comparison of Test performance by Instructional method :
Posttest : FY. B.Sc.
Test Type : Competency Test
|
| Experimental Group | Control Group |
|
| ||||
S. | Category | N | Mean | S.D. | N | Mean | S.D. | ‘t’ (0.01) | P |
1 | All Students | 50 | 58.06 | 4.43355 | 50 | 51.3 | 9.09340 | S (4.72493) | 99.99 % |
2 | All male | 25 | 57.4166 | 4.95745 | 25 | 52.45 | 7.30855 | S (2.75054) | 99.99 % |
3 | All female | 25 | 58.44 | 3.71031 | 25 | 49.92 | 10.4457 | S (3.842988) | 99.99 % |
Table 4 summarizes the analysis of posttest scores of FY.B.Sc. students for both the groups. The mean of the posttest scores (58.06) for the experimental group was significantly higher than the control group (51.3). This difference was significant at the 0.01 alpha levels (‘t’= 4.7249 at 0.01 alpha level). Hence it was concluded that the experimental skill and overall competency of experimental group students was raised as compared to control group students.
Table 5
Comparison of Test Performance by Instructional Method :
Retention test : F.Y. B.Sc.
Test Type : Achievement test
|
| Experimental Group | Control Group |
|
| ||||
S. | Category | N | Mean | S.D. | N | Mean | S.D. | ‘t’ (0.01) | P |
1 | All Students | 50 | 44.68 | 7.36054 | 50 | 34.76 | 5.3499 | S (7.7087) | 99.99 % |
2 | All male | 25 | 44.32 | 8.2690 | 25 | 33.52 | 5.492686 | S (5.4396) | 99.99 % |
3 | All female | 25 | 45.04 | 6.30225 | 25 | 36 | 4.898979 | S (5.6624) | 99.99 % |
Table 5 summarizes the analysis of retention test scores of FY.B.Sc. students for both groups. The mean of the retention test scores (44.68) for the experimental group was significantly higher than the control group (34.76). This difference was significant at the 0.01 alpha levels (‘t’=7.7087 at 0.01 level). Hence it was concluded that the theoretical knowledge of experimental group students was raised and retained.
Table 6:
Comparison of Test Performance by Instructional Method :
Retention test : F.Y. B.Sc.
Test Type : Competency Test
|
| Experimental Group | Control Group |
|
| ||||
S. | Category | N | Mean | S.D. | N | Mean | S.D. | ‘t’ (0.01) | P |
1 | All Students | 50 | 59.7 | 3.04138 | 50 | 51.48 | 8.1565 | S (6.67699) | 99.99 % |
2 | All male | 25 | 56.6 | 3.44093 | 25 | 52.36 | 6.716428 | S (4.69998) | 99.99 % |
3 | All female | 25 | 59.8 | 2.576819 | 25 | 50.6 | 9.29516 | S (4.6726) | 99.99 % |
Table 6 summarizes the analysis of retention test scores of FY.B.Sc. Students for both groups. The mean of the retention test scores (59.7) for the experimental group was significantly higher than the control group (51.48). This difference was significant at the 0.01 alpha levels (‘t’=6.6799 at 0.01 level). It indicated that, the skill and overall laboratory practical competency of the experimental group was raised and retained significantly more than control group students.
Time Analysis.
Table 7 presents the data and analysis of time responses of students to complete the six different stages of experiments. It was found that the overall average time required for the experimental group was significantly lower than the control group students. Hence it was found that the time to complete the experimental criterion for experimental group is less than the control group, has allowed experimental group students more time for critical thinking and drawing conclusion.
Table 7
Comparison of Time : (N= 50)
Activity | Group | Average time in minutes | S.D. | ‘t’ (0.01) |
Design | Control | 23.6 | 2.575 | 44.461 (S) |
Experimental | 5.52 | 1.0736 |
| |
Circuit Assembling | Control | 18.08 | 3.691 | 0.74155 (NS) |
Experimental | 15.58 | 3.01757 |
| |
Observation | Control | 17.02 | 2.699 | 0.6848 (NS) |
Experimental | 16.68 | 2.2446 |
| |
Calculation | Control | 28.3 | 3.29 | 48.099 (S) |
Experimental | 4.56 | 1.1633 |
| |
Result/ Conclusion | Control | 7.92 | 0.853 | 21.57 (S) |
Experimental | 4.28 | 0.834 |
| |
Circuit parameter | Control | 23.32 | 2.591 | 46.61 (S) |
Experimental | 5.52 | 0.762 |
| |
Total Activities | Control | 117.7 | 11.03 | 33.83 (S) |
Experimental | 54.14 | 7.3983 |
|
Findings
A t-test was conducted on the pretest scores for the two treatment groups. The mean of the pretest scores for the experimental group (18.62) was not significantly different from the control group (18.76) (t = 0.188235). Hence, it was concluded that treatment groups were similar.
Research Question 1
Will there be a significant difference in theoretical knowledge of electronics among students in electronics?
As shown in Table 3 and 5, the mean of the posttest scores for the Experimental group (43.03) was significantly higher than the control group (36.8). This difference was significant at the 0.01 alpha level (t = 5.1928). Also the mean of the retention test score for the Experimental group (44.68) was significantly higher than the control group (34.76). This difference was significant at the 0.01 alpha level (t=7.7087).
Research Question 2
Will there be a significant difference in overall competency of students regarding various electronics experiments?
As shown in Table 4 and 6, the mean of the posttest scores for the Experimental group (58.06) was significantly higher than the control group (51.3). This difference was significant at the 0.01 alpha level (‘t’= 4.72493). Also the mean of the retention test score for the Experimental group (59.7) was significantly higher than the control group (51.48). This difference was significant at the 0.01 alpha level (‘t’ =6.676989).
Research Question 3
Will there be a significant difference in time, required to performing the various experiments?
To investigate this question the criterion measure was time to complete the final physical laboratory experiment. The table 7 presents this data. As shown in Table 7, the mean of the Total time required for the Experimental group (54.14 Min) was significantly lower than the controlled group (117.7 Min.). This difference was significant at the 0.01 alpha level), (‘t’ = 33.83).
Discussion
After conducting a statistical analysis on the test scores, it was found that students who used the computer software integrated into laboratory activities performed significantly better on knowledge, skills and overall competency than the students who were taught using the traditional laboratory method of instruction. It was found that the time to complete the experimental criterion for experimental group is significantly less than the control group, and thus allowed experimental group students more time for critical thinking and drawing conclusions.
The computer-based simulation software enabled students to experiment interactively with fundamental theories and applications of electronic devices. It provided instant and reliable feedback. Thus, it gave students an opportunity to try out different options and evaluate their ideas for accuracy, almost instantly. The traditional lab students assumed the lab equipment was not always accurate and reliable and sometimes made the mistake of attributing their design errors to experimental errors. Thus, the simulation activity focused mainly on the mental activity that took place within the learner. The lab activity focused on physical as well as mental activity.
In addition, the time needed for hands-on work may have contributed to the difference between the two groups. The control group had to physically implement their ideas with real components and then test them, which took a lot more time. The control group students could evaluate only a limited number of options within the allotted time. Also, based on informal observations, many students in the control group appeared to be easily frustrated if they took time to build a circuit to test an idea and it did not work as expected. In contrast, the students in the experimental group appeared excited, perhaps because it took relatively less time to test new ideas and concepts and they received immediate accurate feedback.
Conclusions
Based on the results of this study, it can be concluded that effective integration of computer software into traditional laboratory activities enhances the performance of the students. Guided computer software activities can be used as an educational alternative to help motivate students into self-discovery and develop their reasoning skills. The laboratory activity can then focus on the actual transfer of knowledge. This strategy helps improve the effectiveness and efficiency of the teaching-learning process.
In situations where the objective of instruction is to learn the facts without application or transfer, method of instruction is not a significant factor. However, if the educational goal is for students to transfer and apply the knowledge to real-world problems, then simulations integrated into the class structure may be an effective learning strategy. Also, these activities should be based on guided exploratory learning and be designed to stimulate students' thinking processes.
It is recommended that further research be conducted to evaluate the effects of using guided-discovery instructional strategies on enhancing the problem-solving ability of students with different achievement levels, using different academic subject material. Also, there is a need to investigate the different cognitive models that students employ in understanding and evaluating technical concepts. This will provide the research community with vital insight into the design of computer simulations for improving higher-order cognitive skills.
References
Angelidis V.G. (1997). Incorporating Instructional Feedback in Electronics Eng. Laboratory Experiments –An example,” IEEE Trans. on Education,Vol.40, (1).
Bangert-Drowns, R. L.; Kulik, J. A. and Kulik, C. C. (1985). "Effectiveness of Computer-Based Education in Secondary Schools." Journal of Computer-Based Instruction 12/3: 59-68.
Barbieri, M. S., & Light, P. H. (1992). Interaction, gender, and performance on a computer-based problem solving task. Learning and Instruction, 2, 199-213.
Beichner, R. J. (1990). "The effects of simultaneous motion presentation and graph generation in a kinematics lab.” Journal of Research in Science Teaching, 27(8), 803-815.
Beichner, R. J. (1994). Testing student interpretation of kinematics graphs. American Journal of Physics, 62(8), 750-762.
Berge, Z. L. (1990). Effects of group size, gender, and ability grouping on learning science process skills using microcomputers. Journal of Research in Teaching, 27(8), 747-759.
Berger, C. F., Lu, C. R., Belzer, S. J., & Voss, B. E. (1994). Handbook of Research on Science Teaching and Learning. New York: Macmillan.
Busch, T. (1996). “Gender, group composition, cooperation, and self-efficacy in computer studies.” Journal of Educational Computing Research, 15(2), 125-135.154.
Campbell,J.O., & Gibbons, A.S. (1994). Progressively challenging evaluative simulations that provide assessment.learning, and performance support. Journal of Instruction Delivery Systems, 8(2),25-28.
Capper, J., and Copple, C. (1985). Computer Use in Education: Research Review and Instructional Implications. Washington, DC: Center for Research into Practice.
Casey, C. (1996). Incorporating cognitive apprenticeship in multi-media. Educational Technology Research and Development, 44(1), 71-84.
David L. Marrison, Martin J. Frick (1993). "Computer Multimedia Instruction versus Traditional Instruction In Post-Secondary Agricultural Education,”·Journal of Agricultural Education 1993, Volume 34 Number 4.
DeJong, T. and van Jooligen, W.R. (1998). Scientific Discovery learning with Computer Simulations of Conceptual Domains. Review of Educational Research, 68(2), 179-201.
Dewhurst DG, Meehan AS. (1993) Evaluation of the use of computer simulations of experiments in teaching undergraduate students. Br J Pharmacol Proc Suppl 108:238P.
Dietmar Kennepohl (2001). Using Computer Simulations to Supplement Teaching Laboratories in Chemistry for Distance Delivery. Journal of Distance Education/Revue de l'enseignement a distance ISSN: 0830-0445
Gery, G.I. (1991). Electronic performance Support Systems. Boston :Weingarten Publications.
Gokhale, A. A. (1996). Effectiveness of Computer Simulation for Enhancing Higher Order Thinking , Journal of Industrial Teacher Education, 33(4), 36-46.
Gokhale, A. A. (1991). Effectiveness of computer simulation versus lab, and sequencing of instruction, in teaching logic circuits. Journal of Industrial Teacher Education, 29(1), 1-12.
Hofstein, A. & Lunetta, V. N. (1982). The role of the laboratory in science teaching: neglected aspects of research. Review of Educational Research, 52, 201-217.
Kinnaman, D. E.(1990). "What's the Research Telling Us?" Classroom Computer Learning 10/6, 31-35; 38-39.
Kinzie, M. B.; Sullivan, H. J.; and Berdel, R. L. (1988). "Learner Control and Achievement in Science Computer Assisted Instruction." Journal of Educational Psychology 80/3, 299-303.
Kulik, C.-L. C. & Kulik, J. A. (1986). Effectiveness of computer-based education in colleges. AEDS Journal, 19, 81-108.
Kulik, C.-L. C., Kulik, J. A., & Cohen, P. A. (1980). Effectiveness of computer based college teaching: a meta-analysis of findings. Review of Educational Research, 50(4), 525-544.
Kulik, J. A.; Kulik, C. C (1985). "Effectiveness of Computer-Based Education in Elementary Schools." Computers in Human Behavior 1/1: 59-74.
Lewis, T. (1999). Research in technology education: Some areas of need. Journal of Technology Education, 10 (2), 41-56.
M. Aly, J. Elen and G. Willems (2004) Instructional multimedia program versus standard lecture: a comparison of two methods for teaching the undergraduate orthodontic curriculum ,European Journal Of Dental Education: Volume 8 ,Issue 1. Page 43.
MacKenzie, I. S. (1988). Issues and methods in the microcomputer-based lab. Journal of Computers in Mathematics and Science Teaching, 5(1), 12-18.
Redish, Edward, Saul, Jeffrey, Steinberg, Richard. (1996) "On the effectiveness of active-engagement microcomputer-based laboratories.” American Journal of Physics.
Reeves, T.C. (1998). The impact of media and technology in schools: A research report prepared for The Bertelsmann Foundation. Retrieved January 28, 2002, from http://www.athensacademy.org/instruct/media_tech/reeves0.html
Reif, F. & Scott, L. (1999). Teaching scientific thinking skills: Students and computers coaching each other. American Journal of Physics. 67(9), 819-831.
Rivers, R. H., & Vockell, E. (1987). Computer simulations to stimulate scientific problem solving. Journal of Research in Science Teaching, 24(5), 403-415.
Roblyer, M. D. (1988) "The Effectiveness of Microcomputers in Education: A Review of the Research from 1980-1987." Technological Horizons in Education Journal 16/2: 85-89.
Scardamalia, M., Bereiter, C., McLean, R. S., Swallow, J., & Woodruff, E. (1989). Computer-supported intentional learning environments. Journal of Educational Computing Research, 5, 51-68.
Toh Seong Chong (1993) "Use of microcomputer simulations to overcome student misconceptions about displacement of liquids," Australian Association for Research in Education Annual Conference, Fremantle WA.
Sample Software Screens


About the Author
Yogendra Babarao Gandolei is Lecturer in Electronics at Amravati University, Mahavidyalaya, Dhamangaon(Rly), District of, Maharashtra , India. He is an M.Sc. in Communication –Electronics and won awards for Mathematics. Recent publications include Information Technology for masses and globalisation presented to a national seminar on “Information Technology - Current Trends.” at Amravati University.
E-mail : ygandole@indiatimes.com