| August 2009 Index | Home Page |
Editor’s Note: This study is a successful application of computer generated graphics, computer assisted learning and peer assessment to improve a Trigonometry course. It discovered real advantages for team (peer) learning and identified ways that learning styles can modify the outcome for some students. This is an interesting, provocative and well designed “action” research study.
The Roles of Computer Mediated Collaboration
and Peer Assessment in Learning Trigonometric Curves*
Jale Bintas and Firat Sarsar
Turkey
Abstract
The aim of this study is to investigate the roles of computer mediated collaboration and peer assessment in learning trigonometric curves. The subject of this study was a group of 64 students of the Mathematic I class in the Department of Computer Education and Instructional Technologies, Ege Universitesi, Egitim Fakultesi, Bornova, Izmir, in the first semester of 2006-2007. All of the 64 students participated in the multimedia computer-based learning. They were divided in 16 groups and were assigned to use a single PC per 4 students. The duration of the research was planned for 2 weeks. During the first week of the research, we handed out the trigonometric curves formula y= I asinb(x-c) I +d to the class. Groups of the students were asked to draw this trigonometric curve by using Maple 7.0 software with the time limit of 75 minutes. During the second week of the research all the groups were subjects of a 10 minutes exam. We asked them to trace the changes that might occur if some variables of the given trigonometric curve were changed. Group leaders were expected to present their suggestions about the possible differences. In the assessment phase, we analyzed answers given by both the leaders of the groups with regard to the changes in the given trigonometric curve (their answers were video-taped) and their peer assessment. The result of the research demonstrated that students gained extra ability in drawing and analyzing trigonometric curves by using a computer based collaborative learning environment. Moreover, we were able to observe the effects of the computer mediated collaborative learning on the development of their self-confidence and good performance in sketching trigonometric curves.
Keywords: Mathematic teaching, trigonometric curves, computer mediated collaborative learning.
Introduction
With the current emergence of technology in the area of communication, a visible shift can be observed from people working individually towards team work and collaboration. We are finding ourselves at the border of the industrial age moving towards the information age where collaboration has become a necessity. This transition has brought transformations in the corporate and business world that were observed by researchers.
Reigeluth (1999) summarized the “key markers” that characterize the difference between industrial-age organizations and information-age organizations as follows:
Without a doubt, computers and technology have affected the means and modes of communication in education. The new technologies have not only transformed the way students communicate with professors, but also the way in which information is created, reviewed, distributed and stored.
Comparably to the changes brought by technology into the sphere of business, similar trends can be observed in computer mediated learning. Technology has customized learning through its capacity to respond to the individual learner’s style. With the introduction of collaboration, learning is now seen as an interactive process where learners are required to construct their understanding instead of simply memorizing definitions given to them. The collaborative learning paradigm makes use of small groups so that students can work together to take full advantage of each other’s learning.
Table 1
Differences Between Industrial-age Organizations
and Information-age Organizations
Industrial Age | Information age |
Standardization | Customization |
Bureaucratic organization | Team-based organizations |
Centralized control | Autonomy with accountability |
Adversarial relationships | Cooperative relationships |
Autocratic decision making | Shared decision making |
Compliance | Initiative |
Conformity | Diversity |
One-way communication | Networking |
Compartmentalization | Holism |
Parts oriented | Process oriented |
Planned obsolescence | Total quality |
Without a doubt, computers and technology have affected the means and modes of communication in education. The new technologies have not only transformed the way students communicate with professors, but also the way in which information is created, reviewed, distributed and stored.
Comparable to changes brought by technology into the sphere of business, similar trends can be observed in computer-mediated learning. Technology has customized learning through its capacity to respond to the individual learner’s style. With the introduction of collaboration, learning is now seen as an interactive process where learners are required to construct their understanding instead of simply memorizing definitions given to them. The collaborative learning paradigm makes use of small groups so that students can work together to take full advantage of each other’s learning.
Advantages of collaboration were discussed in many previous researches. It was demonstrated that teamwork has significant impacts on student satisfaction (Fulford & Zhang, 1993), better academic performance (Lenning & Ebbers, 1999), higher levels of motivation (Hornbeck, 1990), and a positive attitude towards computer mediated environment (Thompson, 1990).
Collaboration in education improves a student’s analytical, learning, and social skills; however, assessment of an individual’s contribution in collaborative exercises is difficult to perform using traditional evaluation methods. Therefore, the use of an assessment approach that allows students to grade the success of their peers can prove very beneficial in this kind of setting. Peer assessment can be defined as an arrangement for peers to consider the level, value, worth, quality or successfulness of the products or outcomes of learning of others of similar status. (Topping, Smith, Swanson & Elliot, 2000).
Computer mediated communication, cooperative learning, and peer assessment are the main themes providing orientation for this research. These aspects of learning were used during the experimental class aimed on increasing positive academic outcomes of students in solving trigonometric curve problems.
The purpose of the study is to examine the effect of collaborative and computer-mediated learning on academic achievement of students together with their perception of it in the process of solving a trigonometric curve problem.
The study addresses the following research questions:
- What is the relationship between the use of collaborative learning instructional techniques in the process of solving trigonometric curve problem and academic achievements of students?
- How does the nature of the computer mediated learning environment impact student success in solving trigonometric problems?
- What are some of the benefits of peer assessment in the collaborative learning setting?
Methodology
The participants for this study were selected among the freshmen students of the Computer Education Department. A total of 64 students who were enrolled in the Mathematic class offered by Ege University, School of Education, Department of Computer Education and Instructional Technology were chosen as the subject of the given research. At the time of the study students had been introduced to the use of MAPLE 7.0 software that will be utilized later in the process of research. The time frame of the study was planned for two weeks. During the first week the participants were to find their way of solving y= | a. Sin b (x-c) | + d. Discussions in groups of four provided a good atmosphere for analyzing the possible ways of solving this problem. Together they were to recognize or identify different approaches to the given trigonometric curve. Collaboration between peers is seen here as the act of shared creation. The second week was left for the recapitulation of the previous findings and exams. These two stages were followed by an assessment part. During this phase students were tested on what they have learned by two quizzes and an oral examination.
The same concepts are used in the research conducted by Ng and Hu (2006) "Use of web-based simulation in Learning Trigonometric Curves." The goal of the research was to investigate the impact of using trigonometric graphs, a teacher created web-based simulation, and asynchronous online discussion on students’ understanding of and performance in sketching transformation of trigonometric curves. The same model was applied in creating the framework for our study. However, the objective of the given research was to investigate the roles of computer mediated collaboration and peer assessment in learning trigonometric curves.
Instruments
Different sources were used to collect the data for the study, namely: open-ended questionnaires to find students’ attitudes in regards to the computer mediated collaborative learning, quizzes to measure each student’s understanding of trigonometric curves transformation, and video recordings. All the activities were video-taped to monitor the process of student’s collaboration.
Procedures
Sixty-four participants were divided into sixteen groups of four people. From these sixteen groups were formed two cohorts of eight groups each. All the groups were required to come up with a name they would be called during the class periods and to select a leader.
Table 2
Timing and Activity Process
Process | Activies | Time |
1. Week | y= | a. Sin b (x-c) | + d • Using computer for analyzing • Investigating differences among the graphics • Discussing | 75 min |
2. Week | 15 min. for remembering Two different questionnaires | 10 and 15 min. |
Presentations | 5 min per team 16X5 = 80’ |
For the first week the main trigonometric formula y= | a. Sin b (x-c) | + d was given to the students alongside with the keys. A key formula was given to students to begin. The key formula was y=asinx as you can see in Figure 1. They were to investigate this formula before finding the main solution.
|
|
Figure 1. Formula (video recording) | Figure 2. Computer mediated Collaborative Learning Environment |
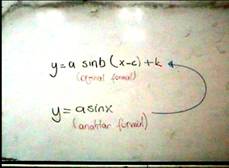
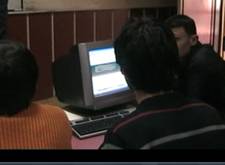
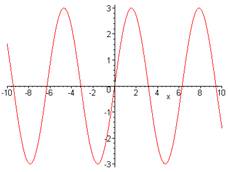
They spent 75 minutes in the computer laboratory working (see Figure 2.) on finding their way to solve the given problem. Each group had access to a computer. With the use of Maple 7.0 software they were to learn how to sketch transformations. They used Maple 7.0 for sketching graphs that can be seen from Graph 1 and Graph 2. The students had opportunity to learn new content with other group members. Thus we made use of collaborative learning environment. This kind of setting proved to be favorable for students in helping them independently recognize solutions to the given problem. In their groups they were expected to not only recognize some possible solutions, but also to analyze each one of them. As a result of the discussions with peers, they created a way out which in their opinion worked the best. Usage of technology is likely to have a considerable impact on students involved in the task solving process where the computer has a potential to increase motivation and to promote deeper learning. Consequently, students have been introduced to the computer-supported collaborative learning environment.
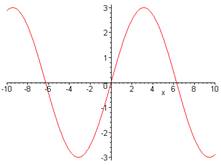
plot (3*sin(x),x); | plot (3*sin(x/2),x); |
|
|
Graph 1. View of Maple Graphs. | Graph 2. View of Maple Graphs. |
At the end of the computer lab session on the second week of study students were given a 15 minute time period for recapitulating what they have learned during the first week. Only at this time were they allowed to use the computers. A paper-based examination was held afterwards when students were asked to answer 5 questions. They had 10 minutes to complete their answers in groups. Each group received one copy of the questionnaire. In the allocated time they were to discuss possible responses. Leaders of the groups were required to write on paper the answers to the problems after listening to the comments of their peers. All the answer sheets were collected so that they could be graded by the teacher. The grades were distributed by the questions as follows:
1. Y=3sinx (2 points)
2. Y=sin1/2x (2 points)
3. Y=sin(x-300) (2 points)
4. Y=3sin1/2x (4 points)
5. Y=sin2(x-450) (4 points)
Total of 14 points per 5 items quiz.
The results of the quiz were only known to the teacher and not to the students. A list of groups was created based on their success in passing the first quiz. The group with the best results was placed on top of the list and groups that scored less were placed respective to their scores.
Throughout the same week students were given a second test in the next class period. This time students received another 5 items quiz that contained open-ended questions. They had 15 minutes to complete this test. The grades were distributed by the questions as follows:
1 | Y=3sinx | How the digit 3 can change the curve? | 10 points |
2 | Y=sin1/2x | How the digit 1/2 can change the curve? | 10 points |
3 | Y=sin(x-300) | How the digit -30 can change the curve? | 10 points |
4 | Y=3sin1/2x | While solving this problem which steps did you follow? Do you think there can be another way out? | 20 points |
5 | Y=sin2(x-450) | While solving this problem which steps did you follow? Do you think there can be another way out? | 20 points |
Total of 70 points per 5 items quiz. |
Assessment
The critical part of the study was left to the end when each team had to present its answers and solutions. Leaders of the groups were to give a five minute presentation while other groups of the first or second cohort had to evaluate the presentation and compare their answers with the ones that had already been presented. The maximum that a group could score during this phase was 100 points (30 points were assigned to the quality or manner in which presentation was made). On the other hand, the teacher was also involved in the evaluation process in grading the responses of students independently.
During the assessment stage, an evaluation paper was given to each group for estimating findings of other groups. The whole peer assessment process was managed confidentially. Teams had no access to the findings of others or to the scores they gave. The total of 16 groups was divided in 2 parts. The first 8 group’s presentations were followed by the other 8 at the end.
Findings
As the result of this study we observed a significant increase of academics achievements for the group of participants. At the beginning of the study each student had to pass the evaluation test. A score between 60 and 100 points was considered as passing.
Graph 3. Average of Student Test Score
Prior to the research, the score of 30 points was the average outcome of the student success (see Graph 3). It shows that they were not successful enough in their academics before the beginning of the study. Upon the completion of the research students scored an average of 82 points. This shows a steep increase in students’ success as the result of the experiment. Collaboration work in groups, computer mediated solutions, and inter-change of learning environments are the key factors for this achievement. Three aspects were taken into consideration when analyzing the outcomes of the study: i) collaboration, ii) computer mediated learning and iii) peer assessment.
Collaboration
Collaboration can be considered as one of the most important aspects of studying in various learning environments (Açıkgöz K., Sarsar F., Altun E., Bonk C.J., Lee, S., Liu, X., Su, B). This study aimed to evaluate the effects of collaboration on meaningful learning. We therefore asked students to answer a set of questions concerning collaboration. The answers to the survey questions facilitated our evaluation of their opinions regarding collaboration.
Table 3
Student’s Views on Collaboration
Student’s Views on Collaboration | Frequency | Percents |
Positive Views - To re-discover friends’ behaviors - To produce new ideas - To share personal knowledge - To save time - To correct wrong knowledge - Effective learning - Multi- brain working |
57 41 38 33 25 22 18 11 |
89 64 59 51 39 34 28 17 |
Negative Views - To be a passive person - To be shy - Low responsibilities - To argue - Self-superiority |
7 4 4 3 2 2 |
11 6 6 5 4 4 |
As Table 3 shows, 89% of all participants gave positive feedback on collaborative learning, comparing to 11% surveyed who had a negative opinion. The majority of respondents that brought out a positive side of the experience emphasized their rediscovering attitudes of their team members. It proved that the process is complex by its nature. Creating new ideas and sharing these ideas with their team members, correcting their misunderstandings and saving time prompted students to develop positive attitudes. In addition, participants defined this kind of environment as being beneficial for the effective learning and multi-brain working. This feedback represents one of the most important details for the research. It proves the environment being sufficient to supply students with the above mentioned abilities. Moreover, they came with the `multi-brain working` name for the lesson setting. However, there were some students that pointed out negative aspects of collaboration. The main concern of this group of students was their fear of becoming passive players in their teams. Additionally they recognized their avoidance of taking the responsibility and timidity in the group discussion. It might have had some negative influences on their successes with the subject. This lack of accomplishment advanced their negative views on collaboration. They draw attention to arguments occurring during discussions. It could be one of the factors that made them feel bad about the collaboration.
Computer mediated learning
Another part of the study was concerned with the use of the computer in the learning process. The computer mediated instruction was included in the original design of the study. Hence, the process combined collaboration with the use of the computer. In order to improve collaboration skills each group needed to use a computer. Consequently we asked students to answer some questions related to their experience of computer mediated collaboration in order to analyze their feedback.
Table 4
Students Views on Computer Mediated Collaboration
Students views on | Frequency (n=64) | Percents (%) |
Positive Views - To take rapid Feedback - Visual - To try different solutions - To save time - To improve self confidence | 61 52 50 46 38 23 | 95 81 75 71 59 35 |
Negative Views - Memorizing - Lock of sharing computer | 3 3 2 | 5 5 4 |
As Table 4 shows, the majority of students had positive opinions about their experience of the computer mediated learning environment. They benefited from the given possibility of receiving rapid feedback and the opportunity to experiment with different solution. The advantage of studying various solutions on a computer rather than on paper was also noted. Another important observation about this method was the improvement in students’ self confidence. The environment helped them to believe in their abilities. On the other hand, several students complained that the computer mediated learning forced them to memorize solutions. Additionally, some of them had disagreements about sharing the assigned computer.
Peer assessment
Peer assessment represented another important part of the research. During the process of research, students were placed in a new position as that of a teacher. They were to evaluate their friends’ activities.
We concluded our study with the peer assessment phase. The chart was given to the students to provide them with criteria for the evaluation. All the groups had to listen to the presentation of their colleagues. Afterwards they were expected to evaluate findings and quality of the presentation of their peers. There were five questions in the second quiz. Three of them were worth 10 points and the other two questions were 20 points each. The maximum of 30 points were left for the presentation. The highest score a group could receive during the evaluation was 100 points. As we mentioned above, the lecturer did not present correct answers to the questions. Therefore we could match the differences of the results as shown below:
Table 5
Matching Results of Evaluation
Result of Evaluation of Teacher (first 4 groups) | Result of Evaluation of Teams (first 4 groups) | Match |
Team A (100 points) | Team A (100 points) | √ |
Team B (100 points) | Team B (100 points) | √ |
Team C (95 Points) | Team C (100 points) | √ |
Team D (95 Points) | Team D (95 points) | √ |
As we see in the Table 5, the list of groups was sorted according to the number of points they received from highest to the lowest. The first four groups on the list scored the best. The list which were evaluated by students was exactly the same as the teacher`s list.
At the end of the evaluation, the whole list and the scores were examined by the teacher. The teacher paid special attention to the last two groups that scored low to see to which group did their points go. The instructor concluded that even if students solved the problem wrong, they would give maximum points to the group that found the correct answer. It shows that they were able to correct themselves while listening to the explanations given by their peers. Moreover, it proves that the peer assessment had impact on the problem solving process.
Table 6
Matching Low-Scored Results of Evaluation
Result of Evaluation | Result of Evaluation | Match |
Team F | Team A (100 points) Team B (100 points) Team C (100 points) Team D (90 points) | √ |
Team G | Team A (100 points) Team B (100 points) Team C (100 points) Team D (90 points) | √ |
Taking into account all the ideas previously presented in the research we can conclude that peer assessment contributed to the student’s understanding of correct answers. Groups that scored the lowest were able to find the right answer and correctly decide how to distribute points among other groups. The following is some of the excerpts from the open-ended questionnaire that was created to evaluate student peer assessment experience:
A. We learned the correct way of solving the problem while listening to the presentations of our friends.
B. His presentation made it so clear to me the way of solving the problem. I cannot believe that we could neglect such an obvious solution
C. My way of solving the problem was quite different from what I have heard in the presentation of my friends. They helped me to see the right way of solving the problem
D. After the presentation made by another group all the difficulties in understanding were gone
However, the situation was not the same in the case of the other group. As we see in the Table 7, Team N received the lowest grade from teacher. Surprisingly enough, at the same time, they scored high in peer evaluation.
Table 7
Matching the Results
Result of Evaluation of Teacher (for second group) | Result of Evaluation of Teams (for second group) | Match |
Team I (100 points) | Team I (100 points) | √ |
Team J (100 points) | Team J (100 points) | √ |
Team K (100 Points) | Team K (100 points) | √ |
Team N (80 points)* | Team N (95 points) ** Team L (95 points) | - - |
* Team N was the 7th from 8 teams for Teacher
** Team N was the 4th from 8 teams for students
It shows that friendship might negatively influence peer assessment. Their colleagues gave the following feedback:
A. He was so funny while giving his presentation. This was the reason why we scored him high. Actually we didn’t care much about his approach to the problem.
B. He is one of my best friends. I know that he will ask me how many points I gave him. So I tried to convince my fellow group members to give him highest points.
C. He was very clear in his presentation. Maybe he made some mistakes in his conclusions. But he was the best presenter.
D. One of my team-friends forced us to score the presenter high.
The lecturer mentioned that “Team N had mistakes that resulted in a wrong conclusion. But the spokesperson of the group did well with the presentation. Moreover, the presenter is one of the most popular students in this class.”
Discussion
This research addressed the process of solving trigonometric curve problems and helped find different methods leading to a solution. The design of the study was thought to incorporate various aspects of learning, namely collaboration, computer mediated collaboration and peer assessment. Collaboration is considered to be one of the most important methods in education. (Açıkgöz, K., Hoppe, H.U.). Collaboration in education helps students share their experiences.
Our study has led us to the conclusion that collaboration is a united effort of students to accomplish common learning objectives and to increase their own and their group members’ individual achievements (Ng, M.W., 2002). There are numerous didactic advantages of collaboration that can add to the learning environment. As it has been demonstrated in the given research, students who work in small groups have been shown to achieve higher levels of academic outcomes. Some other benefits of collaboration are as follows:
§ Reciprocal exchange of ideas and teaching each other fosters active learning.
§ Teamwork enhances retention of study material and promotes a greater depth of learning.
§ Development of stronger analytical skills. The student’s ability to analyze, synthesize and evaluate study material increases.
§ Improvement in communication and interaction among the students.
§ Time is used more efficiently because the same amount of work is completed quicker.
§ Discussion of theoretical concepts is a step closer to their practical application.
Notwithstanding, there are several concerns that were discovered with collaborative learning. These include indifference shown by some students, non-deliberate lack of contribution by some members due to a lack of self-confidence or passive personalities, arguments among peers and distracted attention from the subject of study.
Another problem is assessing individuals within the group. During the teamwork students have no direct supervision of the instructor. Therefore, it would be difficult for an “outsider” to assess the dynamics and collaboration within the group (Buchy, M., Quinlan, K.M., 2000). Whenever we are trying to involve students in a group effort there are two specific conditions that must be met, namely: the students require assurance that their efforts will be fairly evaluated and that students who did not contribute to the work of the group will not benefit from the efforts of others (Johnston, L., Miles, L., 2004).
One way of solving this problem can be found in use of peer assessment. This method of evaluation can engage students in their group work, have them take responsibility for their learning, and minimize the free-loaders. Peer assessment requires students to make the best use of their knowledge in order to review and correct work of a fellow student. In this way it contributes to the development of his/her reflection skills (Haekyung Lee, 2008). Peer assessment encourages students to be critical and independent learners, but as it has been shown in the study, special attention should be given to the obligation of students to be accurate and fair when assessing their peers. The negative side of the peer assessment is the effect that it may have on friendships and inter-personal relationships. In some cases students are aware of the necessity to give high points to a friend in order to maintain the friendship.
Students in the study worked as a team to determine the strategy to be used, but they still maintained their own individual ways of learning. They would articulate their own solution in every group discussion whether logical or not. We reformulated four different sessions in the research below:
These four steps are shown on the video recording. Chart 1 explains the study. The first step of the chart is defining. The second step of the chart is presenting the process of recognizing and re-defining. According to the video tape, students were able to recognize the essence of the problem. However on the individual level, they had to re-defined the problem again. And as we see in step three they began to come up with solutions without even knowing whether they are correct or not.
Table 8
Keys of the Learning Process from the Video Record
Defining | Recognizing | Recognizing | Recognizing | |
Keys From (Some key verbs from video recordings) | Describe Explain | Describe Explain Understand | Describe Explain Understand Design Animate Plan | Describe Explain Understand Design Animate Plan Choose Decide |
During the process of creating solutions they discovered new ways and as a result they had to re-define the problem again. The last part of the chart shows the efforts of students to finalize their solution. All the way through the process they still continued to recognize, re-define and create solutions.
Table 8 demonstrates that “to define” was considered to be a key process. Prior to finding a solution, students had to define the problem over and over again. They thus gained the ability to recognize the problem which led them to several options for solutions. Each group designed its own style of presentation. Some even made use of animation. This shows their creativity. The last phase of the process was to choose their solution and presents their decision. The chart above shows the results of this study. Many different variables affected this chart. For example, the way students used their computers differed. Groups were provided with a computer, but they started to actually use it only during the second phase. During the third phase they were still trying to solve the problem on paper. Such paper based approach was in a way limited. While using the computer they had the chance to see different animated ways of problem solving. It shows that computer mediated collaboration may incorporate different learning facilities. As it was mentioned before, the results may vary from research to research. These changes may help researchers to find learning solutions. Learning processes may change—not only from country to country, but also from student to student in the same
class.
References
Açıkgöz, K. (2004). İşbirlikli Öğrenme. Kanyılmaz Matbaası (6.Baskı), İzmir.
Bonk, C. J., Lee, S., Liu, X., Su, B. (2008). Awareness Design in Online Collaborative Learning: A Pedagogical Perspective Online and Distance Learning: Concepts, Methodologies, Tools, and Applications Chapter 8.6 Indiana University, USA (pp. 3385- 3400).
Buchy, M., Quinlan, K.M. (2000). Adapting the scoring matrix a case study of adapting disciplinary tools for learning centered evaluation. Assessment and Evaluation in Higher Education 25(1), 81-91.
Fulford, C.P., Zhang, S. (1993). Perceptions of interaction: The critical predictor in distance education. The American Journal of Distance Education, 7(3), 8-21.
Hoppe, H.U. (2007). The Role of Technology in CSCL-Educational Information Technologies and Collaborative Learning. (Editors : Hoppe, H.U., Ogata, H., Soller A.). Springer Science + Business Media, LLC. New York.
Hornbeck, D.W. (1990). Technology and students at risk of school failure. Minneapolis, MN: Chief State School Officer’s State Technology Conference. (ERIC Document Reproduction Service No. ED 327 175).
Johnston, L., & Miles, L. (2004). Assessing contributions to group assignments. Assessment & Evaluation in Higher Education, 29(6), 751-768.
Lee, Haekyung. (2008). Students’ Perceptions of Peer and Self Assessment in a Higher Education Online Collaborative Learning Environment, Graduate School of the University of Texas at Austin.
Lenning, O.T., Ebbers, L.H. (1999). The powerful potential of learning communities: Improving education for the future. ASHE-ERIC Higher Education Report, 26(16), 1-173.
Ng, M.W. (2002). Enhancing collaborative learning through online discussion and peer assessment, Proceedings of the International Conference on Computers in Education 2002, (pp. 262 – 263).
Ng, B.K. & Hu, C. (March, 2006). Use web-based simulation to learn trigonometric curves, International Journal for Mathematics Teaching and Learning.
Reigeluth, C.M. (1999). What is instructional design theory and how is it changing. In Reigeluth, C.M. (Ed), Instructional-desing Theories and Models Vol. II (pp. 5-30). Mahwah, NJ: Lawrence Erlbaum Associates.
Sarsar F. (2008). Effects Of Online Collaborative Learning Environments On Social Skills Of Pre-Service Teachers, Ege University, Applied Science Institute, Master Thesis, Izmir, Turkey.
Sarsar F, Altun E. (2008). The Effects of Social Skills of Synchronize and Asynchronies Collaborative Learning Environments, 2nd International Computer and Instructional Technologies Symposium 16-18 April 2008, Izmir.
Thompson, G. (1990). How can correspondence-based distance education be improved? A survey of attitudes of students who are not well disposed toward correspondence study. Journal of Distance Education, 5(1), 53-65.
Topping, K. J., Smith, E. F., Swanson, I., & Elliot, A. (2000). Formative peer assessment of academic writing between postgraduate students, Assessment and Evaluation in Higher Education, 25(2), 146-169.
About the Authors:
| Assoc. Prof. Dr. Jale Bintas |
| Firat Sarsar e-mail: firat.sarsar@ege.edu.tr personal web-site: www.firatsarsar.com |


* This paper was oral-presented at 2nd International Computer and Instructional Symposium at Ege University on 16-18 April 2008